
Cognitive Load Reduction: Simplify UX with Behaviour Analytics
Published on: 16 Jun 2026
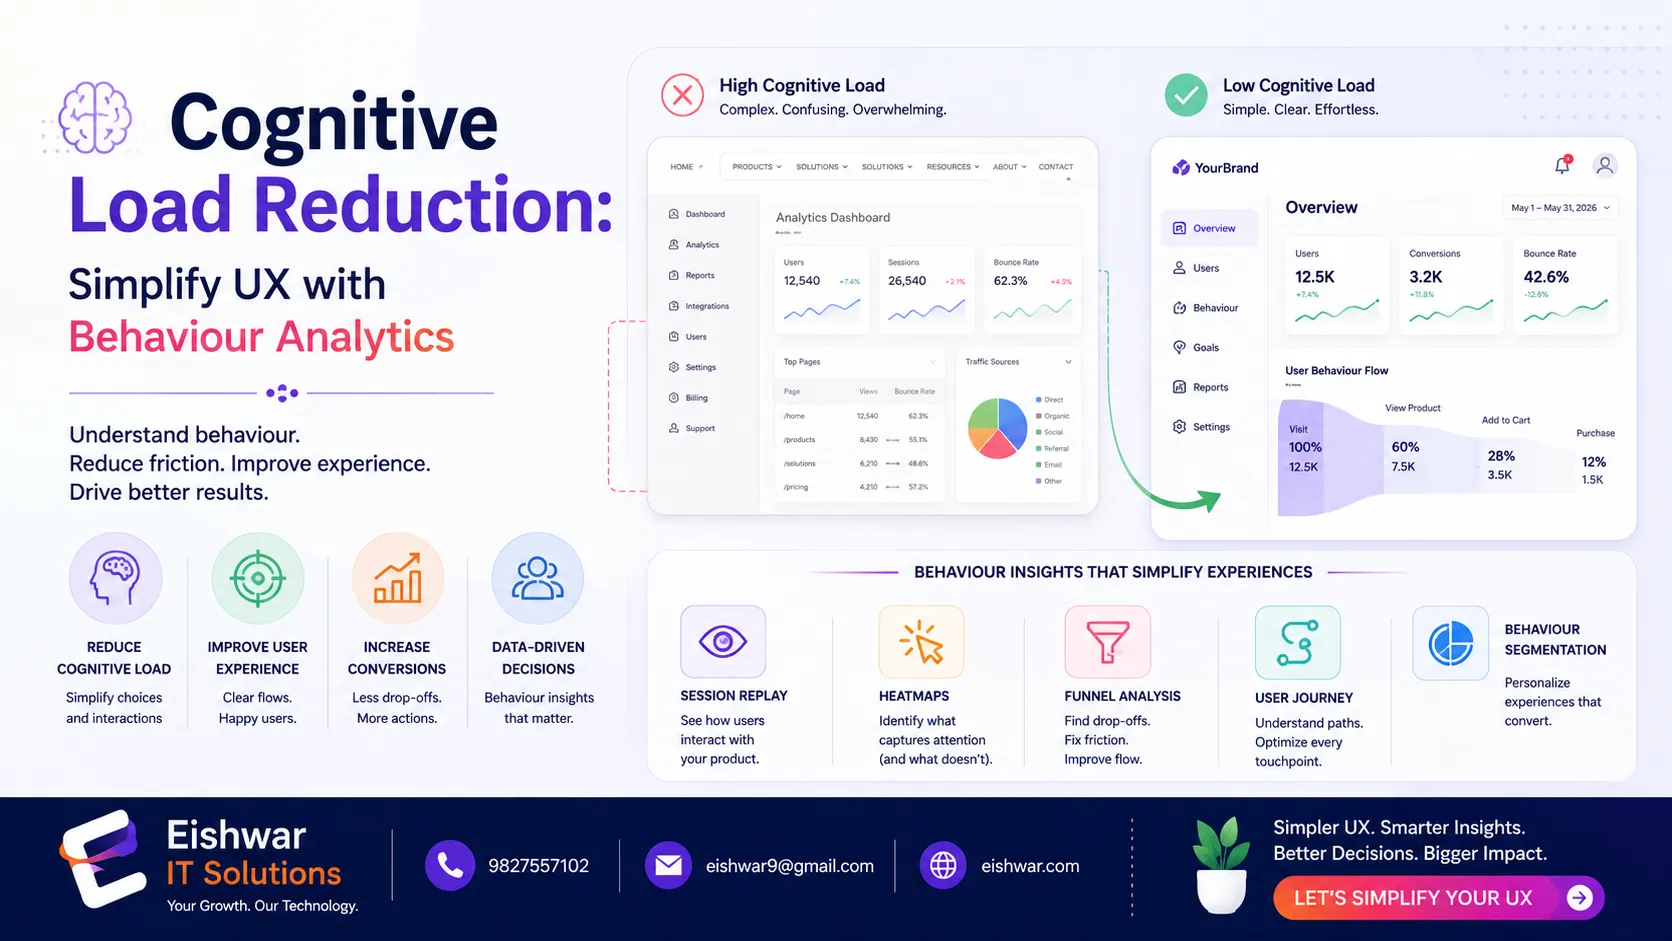
Cognitive Load Reduction: Using Behaviour Analytics to Simplify UX for Indian Users
Introduction
In today's fast-paced digital world, users expect seamless, intuitive experiences. Yet many websites and apps overwhelm visitors with complex navigation, too many choices, and cluttered interfaces. This mental strain is called cognitive load — and it's a silent killer of conversions.
Learn more about our Website services
For Indian businesses targeting local audiences, reducing cognitive load is especially critical. Indian users often face slower internet speeds, diverse device types, and varying digital literacy levels. By leveraging behaviour analytics, you can identify exactly where users struggle and simplify their journey.
In this guide, we'll explore practical strategies to reduce cognitive load using data-driven insights. You'll learn how to apply these techniques to your UX/UI design, backed by real examples and actionable tips. Whether you're a startup founder, a product manager, or a UX designer, these methods will help you create interfaces that feel effortless.
Main Section 1: What is Cognitive Load and Why It Matters for Indian Users
Cognitive load refers to the amount of mental effort required to use a product. When users face too many options, unclear labels, or complex workflows, they experience decision fatigue and often abandon the task. In cognitive psychology, this is often broken into three types: intrinsic (inherent complexity of the task), extraneous (unnecessary elements in the design), and germane (effort to learn and build mental models). For UX designers, the goal is to minimise extraneous load while optimising germane load.
For Indian audiences, factors like language diversity, cultural preferences, and mobile-first usage amplify the impact of cognitive load. A study by Google found that 53% of mobile users in India abandon a site if it takes more than 3 seconds to load — and cognitive overload contributes to perceived slowness. Additionally, many Indian users switch between languages (e.g., Hindi, Tamil, Bengali) and expect interfaces to adapt. Behaviour analytics tools like heatmaps, session recordings, and click tracking reveal where users hesitate, click repeatedly, or drop off. These insights help you pinpoint high-cognitive-load areas and redesign for clarity.
Example: An Indian e-commerce site noticed users abandoned the checkout page after seeing 10 payment options. By analysing session recordings, they reduced options to 4 most-used methods (UPI, Net Banking, Credit Card, and Cash on Delivery) and added a clear progress bar. Conversion rates jumped by 22%. This simple change eliminated the paradox of choice, a classic cognitive load trap.
Another real-world case: A popular Indian news app found that users spent over 30 seconds scanning a cluttered homepage. By using heatmaps to identify the most-clicked categories (e.g., cricket, politics, and local news), they redesigned the layout with a personalised feed. Average session duration increased by 40%, and bounce rate dropped by 15%.
Main Section 2: Practical Steps to Reduce Cognitive Load with Behaviour Analytics
Here are proven methods to simplify UX using behaviour data. Each step is actionable and backed by examples from Indian digital products.
1. Simplify Navigation – Use analytics to identify the most visited pages. Reduce menu items to 5-7 core categories. For Indian users, add regional language support in navigation labels. For instance, a travel booking site noticed that users from Gujarat frequently searched for 'Ahmedabad to Mumbai' but struggled with English labels. Adding Gujarati text in the navigation dropdown reduced bounce rate by 18%.
👉 Don't wait for the perfect moment; turn your vision into reality today.
Free Consultation2. Minimise Choices (Hick's Law) – Track where users click on product pages. If multiple CTAs compete for attention, consolidate them. For example, combine 'Buy Now' and 'Add to Cart' into a single primary action. An Indian fashion retailer found that users clicked both buttons equally, causing confusion. After merging them into a single 'Shop Now' button, click-through rates rose by 25%.
3. Use Progressive Disclosure – Show only essential information first. Behaviour analytics can tell you which features users ignore. Hide advanced options behind 'More Details' links. A fintech app discovered that only 10% of users accessed the 'Investment Portfolio' feature. By moving it to a secondary menu, they reduced initial page load time and improved sign-up rates by 12%.
4. Optimise Forms – Analyse form field completion rates. Remove unnecessary fields, use inline validation, and auto-detect location for Indian addresses. One fintech app reduced form fields from 12 to 6 (name, phone, email, PAN, address, and UPI ID), increasing sign-ups by 35%. They also added a 'Scan Aadhaar' option to auto-fill personal details, reducing manual entry errors.
5. Leverage Familiar Patterns – Indian users are accustomed to certain UI patterns like WhatsApp-style chat buttons or UPI payment icons. Use analytics to confirm which patterns your audience recognises and replicate them. For example, a food delivery app added a floating chat button similar to WhatsApp, and engagement with customer support increased by 30%. Similarly, using the familiar green UPI icon for payments reduced checkout abandonment by 20%.
6. Implement Smart Defaults – Behaviour analytics can reveal common user paths. Set smart defaults based on past behaviour. For instance, if 70% of users select 'Cash on Delivery' as payment method, pre-select it in the checkout flow. This reduces decision time and cognitive effort.
Main Section 3: Tools and Metrics for Measuring Cognitive Load
To reduce cognitive load, you must measure it. Here are key metrics and tools that provide actionable insights:
Task Success Rate – Percentage of users who complete a key action (e.g., purchase, sign-up). Low rates indicate high cognitive load. Aim for above 80% for critical tasks.
Time on Task – Longer times suggest confusion. Behaviour analytics tools like Hotjar or Crazy Egg track this. For example, if users take more than 2 minutes to fill a simple form, it's a red flag.
Click Heatmaps – Reveal where users click repeatedly on non-clickable elements, indicating frustration. A common pattern is users clicking on images expecting them to be links. Fixing this reduces cognitive friction.
Scroll Depth – If users stop scrolling early, content may be too dense. Use analytics to trim copy and break text into scannable sections. For Indian users, consider adding bullet points and bold headings to improve readability.
Session Recordings – Watch real user sessions to spot hesitation (mouse hovering, repeated clicks). This qualitative data is gold for simplification. For instance, a session recording might show a user hovering over a 'Submit' button for 5 seconds before clicking—indicating uncertainty about the action.
👉 Free Website Audit
Get Free AuditError Rate – Track how often users encounter errors (e.g., invalid form fields, broken links). High error rates increase cognitive load. Use analytics to identify common error patterns and fix them proactively.
For Indian businesses, affordable tools like Microsoft Clarity (free) or Matomo (self-hosted) work well. Pair them with Google Analytics for quantitative data. For regional language support, consider tools like FullStory that offer session replay with language detection.
Case Study: A travel booking site used heatmaps to find that users struggled with multi-city flight searches. The interface required selecting multiple dropdowns and dates. They redesigned the interface to show a single search bar with auto-suggest (e.g., 'Delhi to Mumbai via Jaipur'), reducing average task time from 4 minutes to 1.5 minutes. Task success rate increased from 60% to 85%.
Expert Tips
- Start Small: Pick one high-traffic page with high bounce rate. Use behaviour analytics to identify one cognitive load issue and fix it. For example, a landing page with a 70% bounce rate might have too many CTAs.
- Test with Real Users: Run A/B tests on simplified versions. For Indian audiences, include users from Tier-2 and Tier-3 cities where digital literacy varies. Use platforms like UserTesting India to recruit diverse participants.
- Use Microcopy: Clear, concise labels reduce cognitive load. Replace 'Submit' with 'Get My Quote' for clarity. For Indian users, add local language microcopy (e.g., 'अपना कोट प्राप्त करें' for Hindi speakers).
- Embrace Whitespace: Indian users appreciate clean layouts. Use analytics to ensure whitespace doesn't hide key actions. A cluttered page with 80% text density can be overwhelming; aim for 40-50% whitespace.
- Leverage Social Proof: Show reviews and trust badges near CTAs to reduce decision anxiety. For example, a 'Trusted by 10,000+ customers' badge near the 'Buy Now' button can increase conversions by 15%.
- Optimise for Mobile First: Over 70% of Indian users access the web via mobile. Use behaviour analytics to test mobile-specific flows, such as thumb-friendly button placement and reduced form fields.
Common Mistakes
- Overloading with Features: Adding too many options based on analytics without prioritising. Focus on the 20% of features used by 80% of users (Pareto Principle). Avoid feature creep.
- Ignoring Mobile Context: Indian users are mobile-first. Desktop analytics alone miss mobile-specific cognitive load issues, such as small touch targets or slow loading on 3G networks.
- Using Jargon: Technical terms increase cognitive load. Use plain language familiar to your audience. For example, replace 'KYC Verification' with 'Identity Check' for non-finance users.
- Neglecting Loading Speed: Even with simplified design, slow load times increase perceived cognitive load. Optimise images (use WebP format), minify code, and leverage CDN for faster delivery.
- Not Testing with Local Users: Global UX patterns may not suit Indian users. Always validate with local behaviour data. For instance, a hamburger menu might be less intuitive for older users in India; consider a bottom navigation bar instead.
- Overlooking Accessibility: Many Indian users have visual or motor impairments. Use analytics to ensure your design meets WCAG guidelines, such as sufficient colour contrast and keyboard navigation.
Future Trends
By 2026, AI-driven behaviour analytics will predict cognitive load in real-time. Interfaces will adapt dynamically — for example, hiding complex options for stressed users (detected through mouse movement patterns) or offering voice navigation for low-literacy users. Indian businesses should prepare by collecting first-party behaviour data now and investing in AI tools like Google Analytics 4's predictive metrics.
👉 Free Homepage Demo
Book DemoAnother trend is inclusive design — using analytics to serve users with varying digital skills. Expect more vernacular interfaces (e.g., full Hindi, Tamil, or Bengali UIs) and gesture-based navigation (e.g., swipe to confirm actions). For example, a banking app might offer a simplified 'lite' mode for first-time users.
Finally, ethical use of behaviour analytics will become a differentiator. Transparent data practices will build trust, especially among privacy-conscious Indian users. Avoid dark patterns like hidden opt-ins; instead, use analytics to create honest, user-friendly experiences. By 2025, 40% of Indian consumers are expected to prioritise privacy in their digital choices.
FAQs
What is cognitive load in UX design?
Cognitive load is the mental effort users need to interact with a product. High cognitive load leads to frustration and abandonment. Reducing it makes interfaces easier to use by minimising unnecessary complexity.
How does behaviour analytics help reduce cognitive load?
Behaviour analytics tools like heatmaps, session recordings, and click tracking show exactly where users struggle. This data helps you simplify navigation, forms, and content. For example, if users repeatedly click on a non-clickable element, you can make it interactive or remove it.
What are the best tools for measuring cognitive load in Indian users?
Affordable tools include Microsoft Clarity (free), Hotjar, and Matomo. Pair them with Google Analytics for comprehensive insights. For Indian users, ensure tools can handle regional language analytics and mobile-specific metrics. FullStory and Crazy Egg also offer advanced session replay features.
Can simplifying UX really improve conversion rates?
Yes. Reducing cognitive load directly lowers bounce rates and increases task completion. Many Indian businesses see 20-35% improvement in conversions after simplifying key user flows. For instance, reducing form fields from 10 to 5 can boost sign-ups by 30%.
What are common cognitive load issues specific to Indian users?
Common issues include complex payment gateways (too many options), lack of regional language support, cluttered mobile interfaces, and too many navigation options. Behaviour analytics can identify these by tracking drop-off points and user hesitation patterns.
How long does it take to see results from cognitive load reduction?
Results can be seen within 2-4 weeks after implementing changes. Use A/B testing to compare metrics like bounce rate, task success rate, and conversion rate. Quick wins like simplifying a form or navigation can show immediate improvement.
Is cognitive load reduction only for mobile users?
No, it applies to all devices. However, mobile users in India are more affected due to smaller screens and slower networks. Behaviour analytics should cover both desktop and mobile to ensure a consistent experience.
Conclusion
Reducing cognitive load is not just about aesthetics — it's about respecting your users' time and mental energy. By leveraging behaviour analytics, Indian businesses can create intuitive experiences that drive loyalty and conversions. Start small: pick one metric, one tool, and one page. Analyse, simplify, test. Your users will thank you with higher engagement and more sales. Remember, every click saved is a step toward a better user experience.
CTA
Ready to simplify your UX with data? Contact EishwarITSolution for a free behaviour analytics audit. Our experts will identify cognitive load hotspots and recommend actionable fixes. Get started today and see the difference in your conversion metrics.