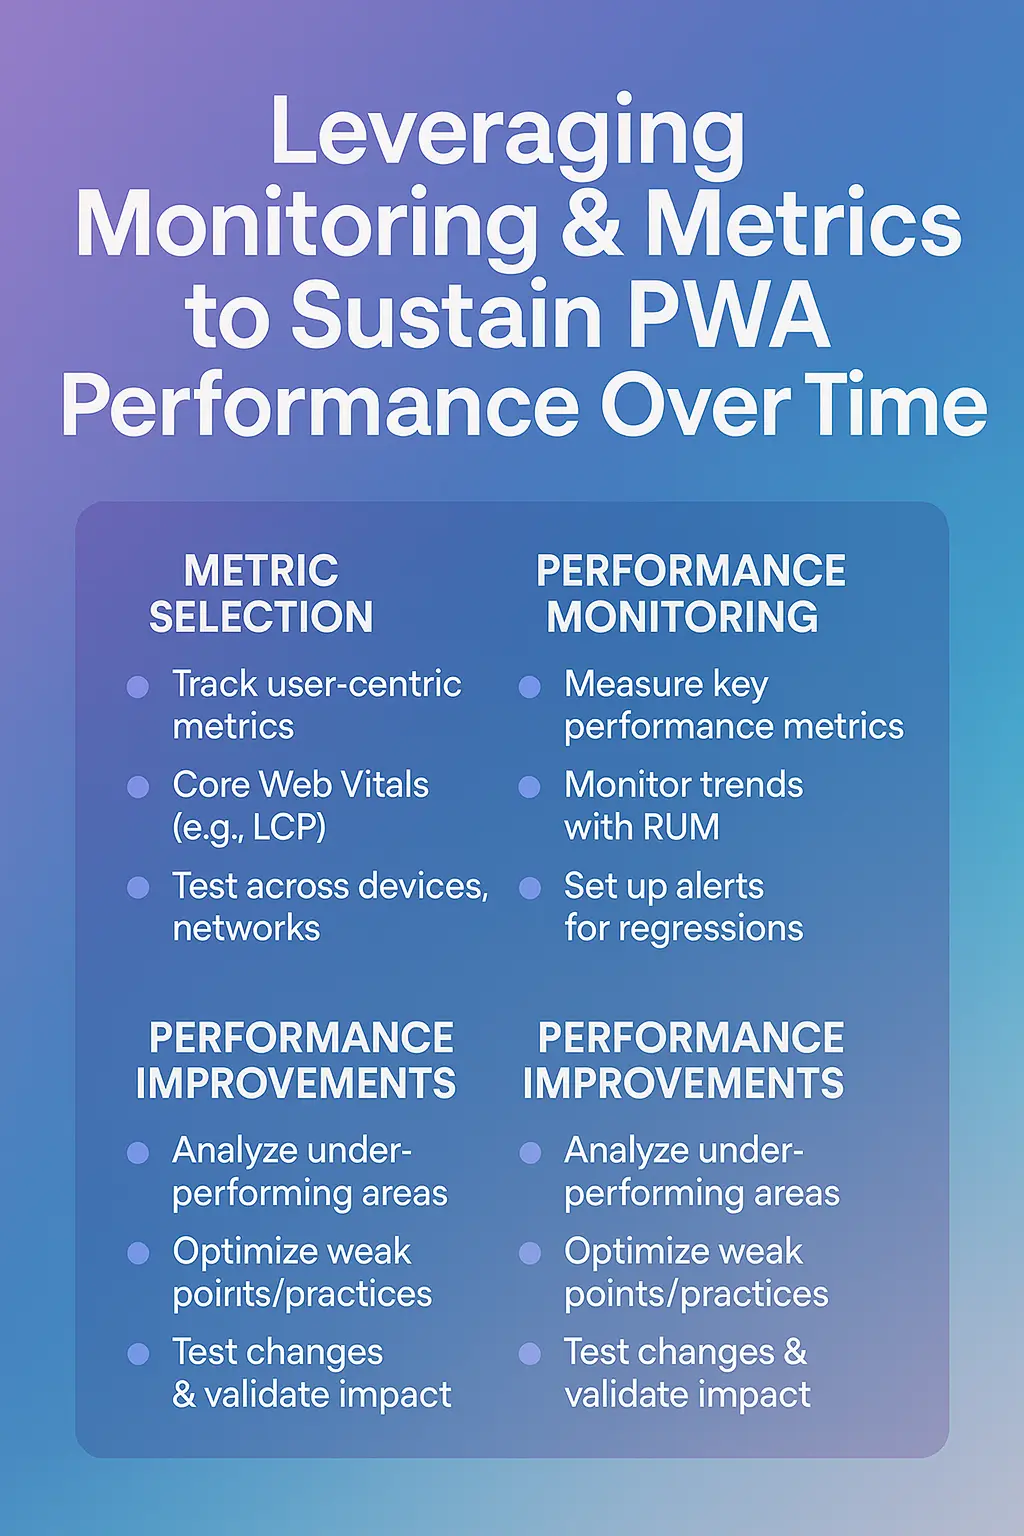
Leveraging Monitoring & Metrics to Sustain PWA Performance Over Time
Published on: 10 Nov 2025
Introduction
Performance isn’t a “set and forget” item—it’s a continuous commitment. When building a Progressive Web App (PWA), monitoring, measuring and iterating on performance is just as important as the initial build. In this blog, we dive into the key metrics, tooling, and workflows you need to sustain high performance for your PWA over time.
Why monitoring matters
A PWA’s performance directly influences user satisfaction, engagement and conversion. Metrics such as load time, responsiveness, stability (all part of Core Web Vitals) are linked to business outcomes. tameta.tech
Still, many PWAs under-perform because they lack real-user insights: Are service workers hitting cache? Are users on slow networks struggling? Are third-party scripts slowing things? Monitoring answers these questions.
Key metrics to track
Core Web Vitals
Largest Contentful Paint (LCP): measures when the main content is visible.
First Input Delay (FID): measures how responsive the app is to user input.
Cumulative Layout Shift (CLS): measures visual stability. tameta.tech+1
Service Worker & Cache Metrics
Cache hit ratio: percentage of requests served from cache vs network. Datadog
Offline usage rate: number of sessions where user was offline/had poor network.
Service worker fetch latency: how much delay the service worker introduces.
Network & Resource Metrics
Time to first byte (TTFB)
Number of requests, payload size (initial bundle, images etc)
Slowest third-party scripts/resources
User-Experience Metrics
Time to interactive (TTI)
Bounce rate, session duration, conversion rate (business KPIs)
Engagement from install prompt (for installable PWAs)
Tools & methods for monitoring
Google Lighthouse: Run audits during development and CI to catch regressions. tameta.tech
Real User Monitoring (RUM): Collect performance data from actual users/devices across browsers and networks.
Synthetic tests: Regular tests under controlled conditions (desktop/mobile, throttled networks) to catch early issues. Datadog
Service Worker analytics: Monitor service worker registrations, cache events, fetch handling times.
Error & crash tracking: Across browsers/devices to spot compatibility, offline issues or PWA install problems.
Building a performance improvement loop
Baseline audit: Use Lighthouse + manual tests to get baseline performance and detect bottlenecks.
Define performance budget: e.g., initial bundle < 150 KB, LCP < 2.5 s, CLS < 0.1, cache hit ratio > 80%.
Instrument monitoring: Set up dashboards for metrics above, break down by browser, device, network speed.
Analyse and prioritise: Identify largest performance hits—heavy resources, slow server responses, poor caching.
Implement improvements: Asset optimisation, caching logic tweaks, server improvements, lazy-load non-critical modules.
Verify and deploy: Run audits again, check monitoring data post‐deployment to confirm improvement.
Repeat: As you add features, run audits and check metrics again. Build performance into your process.
Real-world scenarios and lessons
Imagine you roll out a new feature but bundle size increases by 90 KB and your LCP goes from 2.1 s to 3.0 s. Without monitoring this slip might go unnoticed until users complain.
Perhaps service worker cache hit ratio drops after a manifest change, causing more network fetches—without analytics you won’t catch this. Datadog
On slower networks (2G/3G), image downloads may still dominate load time unless you lazy-load and switch to modern formats. Studies show WebP/AVIF formats can reduce load times significantly. arXiv
Best practices for maintaining high-performance PWAs
Make performance part of your CI/CD pipeline: run Lighthouse audits and fail builds if budgets are exceeded.
Include performance reviews in your feature planning: every new feature must evaluate its performance cost.
Keep third-party scripts under control: audit, lazy-load or remove if they’re slowing things down.
Test offline and network-poor scenarios: ensure your app still provides meaningful content and smooth UI.
Monitor across browsers/devices: PWAs must adapt to low-end devices and different browsers. MDN Web Docs
Communicate metrics with stakeholders: Turn performance KPIs into business language—“every 500 ms delay drops conversion by X %”.
Conclusion
Building a fast PWA is only half the battle; keeping it fast, resilient and user-friendly over time is where the real ROI lies. By tracking the right metrics, implementing monitoring tools, and embedding performance in your development cadence, you can ensure your PWA remains a competitive asset. If you commit to the performance lifecycle—measure, optimise, monitor—you’ll deliver an experience that keeps users engaged, satisfied and coming back.
